Harmful Algal Bloom South Australia
Check out these pages available here to support ongoing HAB monitoring in South Australia. You can explore the data yourself here:
🔗 Luke’s HAB Monitoring Portal
An example of the Luke’s HAB Monitoring Portal attached on the picture below; the dots on the map represent all phytoplankton samples analysed and uploaded to Luke’s Streamlit HAB Monitoring portal over the past 10 days, coming from both government and private sources. put together a prototype interactive dashboard to track and understand the current harmful algal blooms in South Australian waters. This free, open-access tool provides easy-to-use visualisations of SA government algal bloom data, hopefully helping communities, researchers, and decision-makers stay informed.
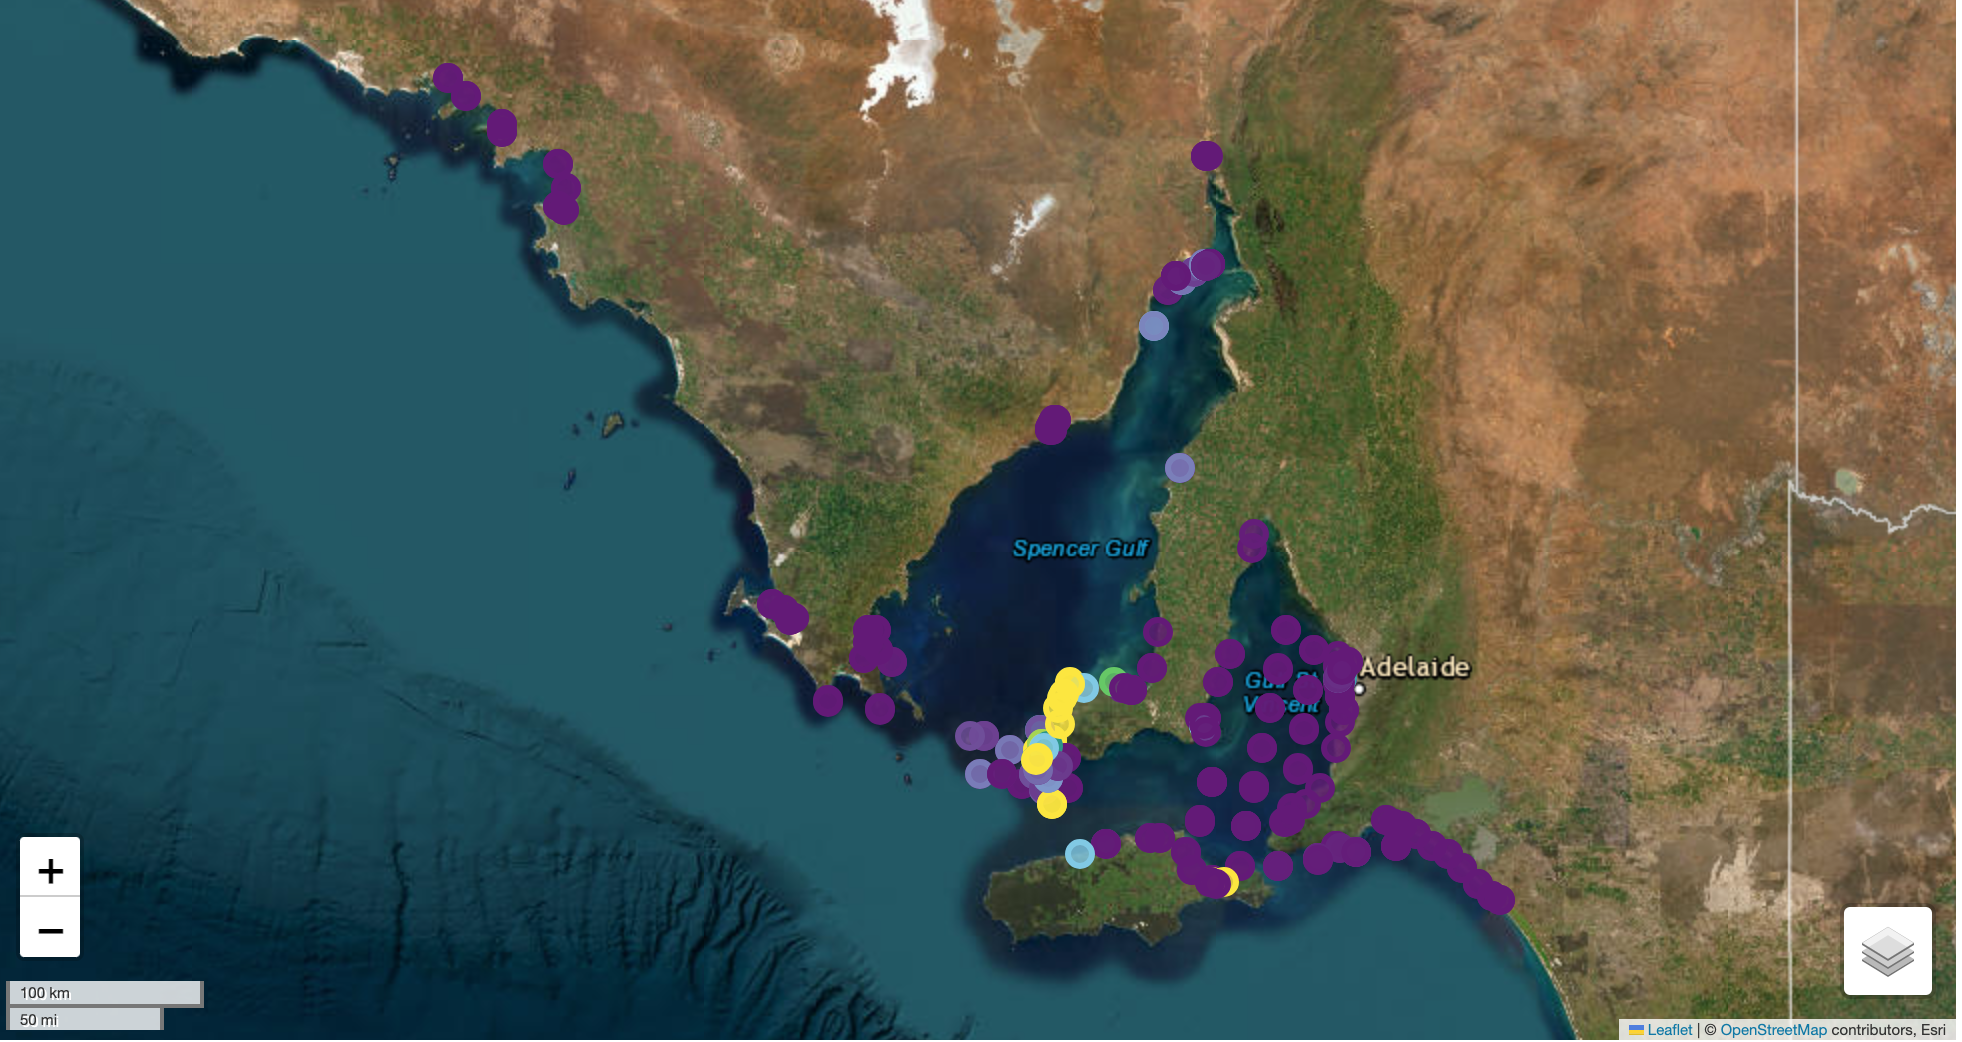
On the portal’s Karenia layer:
- Dark purple indicates zero or very low cell counts.
- Light purple shows areas that are starting to rise and need watching.
- Yellow marks locations where we typically begin to see significant wildlife impacts, including large numbers of dead animals.
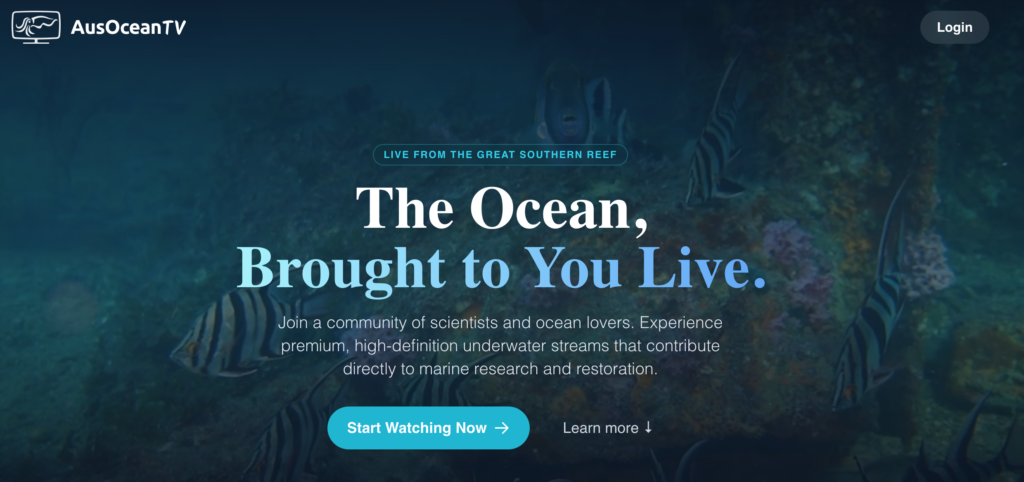
Watch Live from the Great Southern Reef The Ocean, Brought to You Live by AusOcean.
Join a growing community of scientists, divers, and ocean lovers tuning in to premium, high‑definition underwater streams that support real marine research and restoration. It’s a chance to witness the reef as it truly is – alive, changing, and full of stories worth protecting.
Visit for the official government data – updated first, with more detailed metadata but without private/community samples